M E M E S I S A I

Business Automation Platform

Our Location

Dashboard Insights

Platform Dashboard Insights

Overview

The Dashboard provides clients with a centralized, real-time view of their software robot operations, ensuring complete transparency and actionable insights. Designed to simplify monitoring and management, this web-based interface offers a clear snapshot of essential performance metrics, helping businesses optimize their robotic processes and address issues proactively.
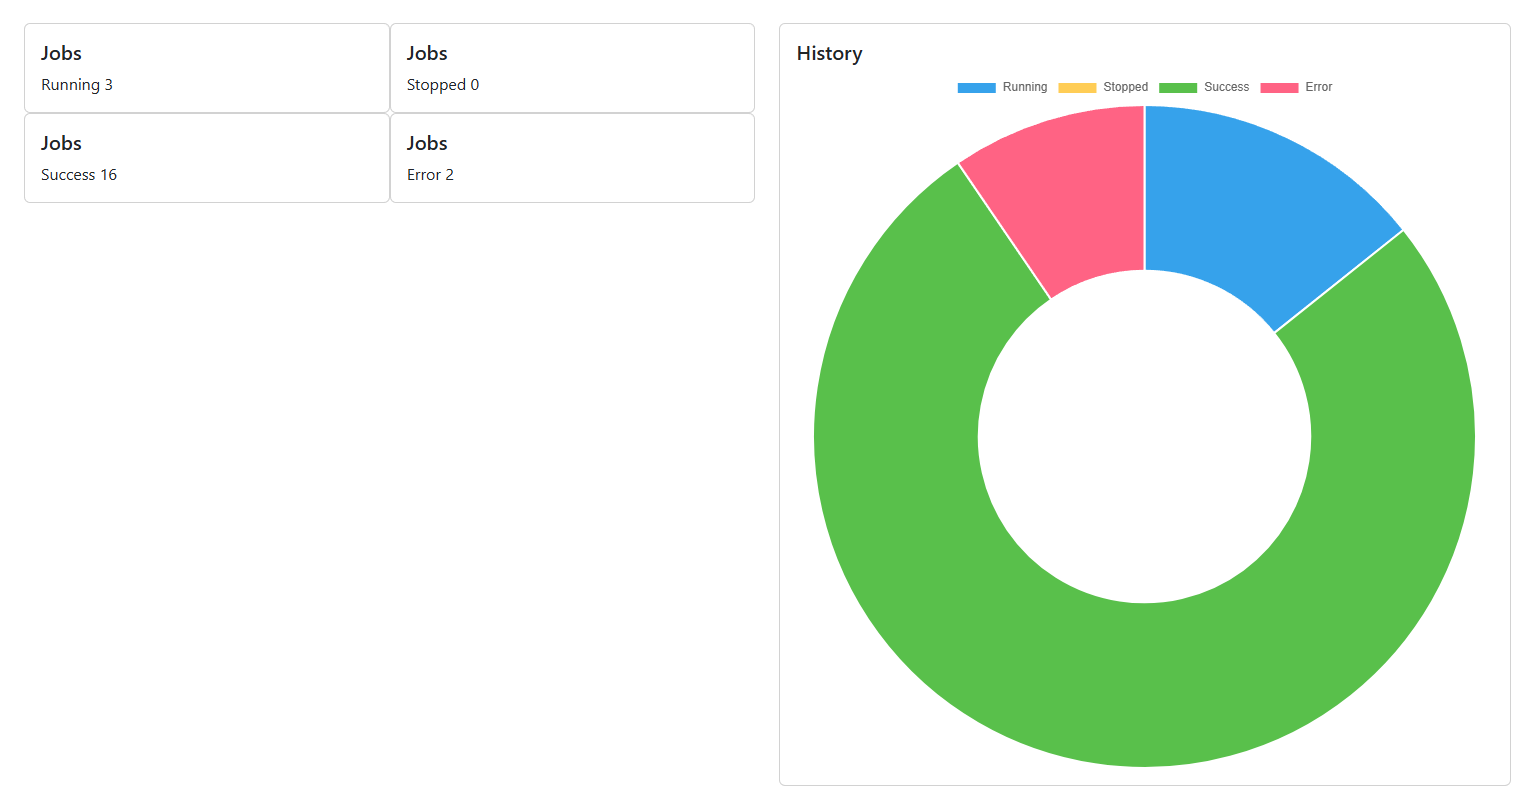
The Dashboard displays key information, such as:
Number of Processes: Track the total number of robotic processes deployed.
Running Jobs: Monitor jobs currently in execution.
Success Jobs: Keep an eye on tasks completed successfully.
Stopped Jobs: Identify paused or incomplete tasks.
Error Jobs: Highlight failed tasks requiring immediate attention.

This user-friendly interface empowers clients to make informed decisions, ensure efficient workflow management, and address operational inefficiencies effectively.

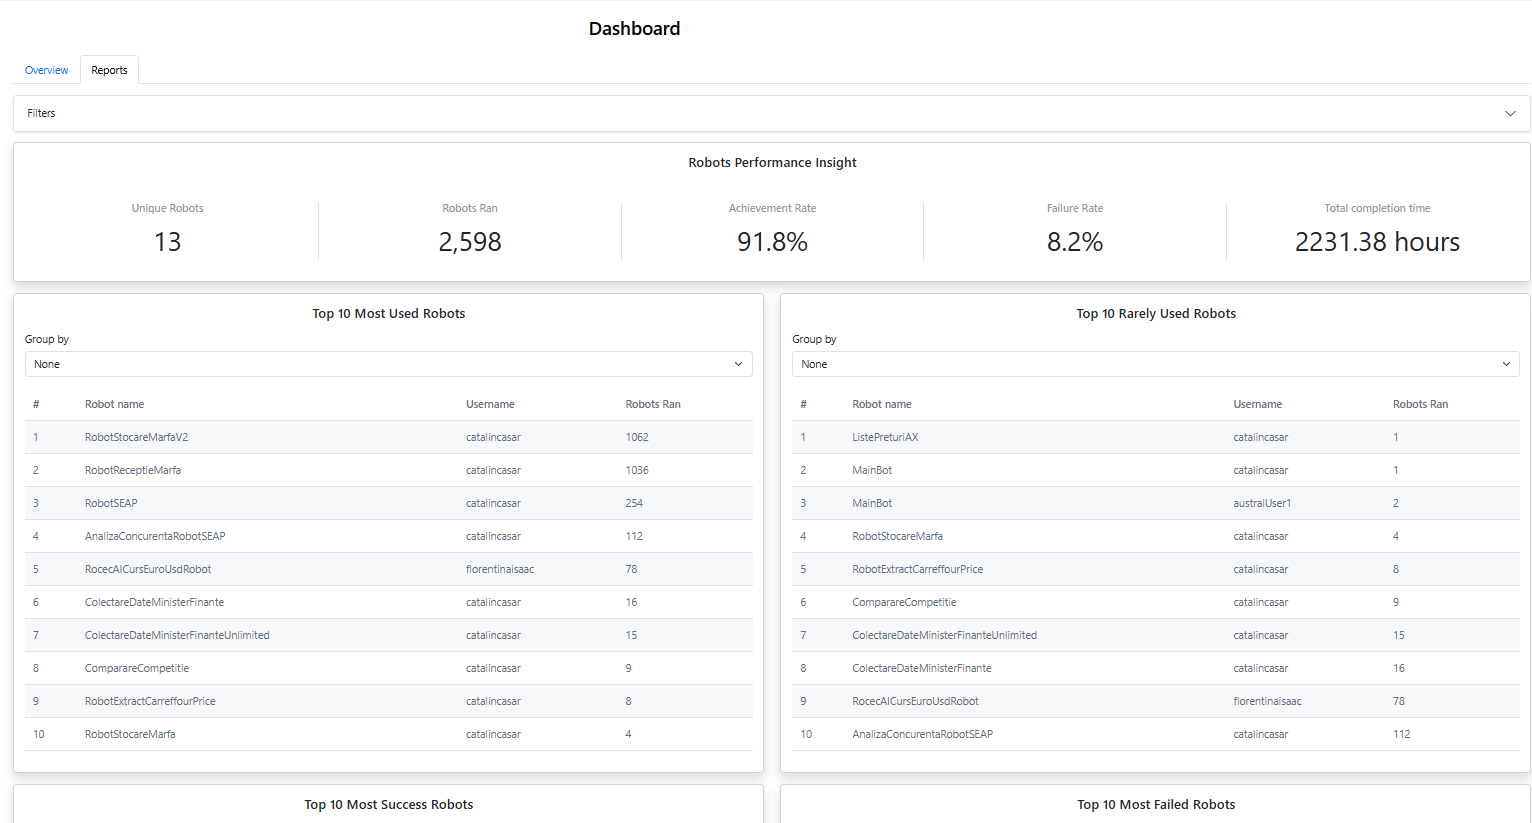
Robots Performance Insight

The Robots Performance Insight interface provides an in-depth analysis of the performance and usage of software robots, empowering clients with actionable insights to optimize operations and identify key trends.
This dashboard is designed to facilitate monitoring, performance evaluation, and user activity tracking, ensuring businesses achieve their automation goals efficiently.

Detailed Insights
Top 10 Most Used Robots: Lists the robots with the highest execution frequency, showcasing their contribution to overall operations.
Top 10 Rarely Used Robots:Highlights the robots with the lowest execution frequency, helping to identify underutilized automation assets.
Top 10 Most Successful Robots: Ranks robots based on their achievement rate, providing a clear view of the most reliable bots. This metric is vital for understanding which bots consistently perform tasks without errors.
Top 10 Most Failed Robots: Displays robots with the highest failure rates, enabling clients to identify and address performance bottlenecks or operational issues.
Top 10 Most Active Users: Provides an overview of users with the highest robot usage, helping to assess team engagement and workload distribution.
Top 10 Least Active Users: Shows users with the lowest robot activity, allowing for a balanced assessment of resource utilization.
Visual Enhancements

The interface includes an intuitive grouping feature and organized tables for easy navigation and analysis.
By providing segmented insights across performance, activity, and success/failure metrics, this dashboard ensures a comprehensive understanding of both robot and user engagement.

Optimize automation workflows.
Address underperformance effectively.
Maximize the value of deployed robots and engaged users.
Blog Comments (2)

"The team at Memesis AI goes above and beyond to provide exceptional support and service. From the initial consultation to the final deployment, they were there every step of the way, ensuring a seamless integration with our new software robots.”

"We approached Memesis AI with complex business proceses to be automated, and they were able to provide an innovative solution that addressed our needs perfectly. Their team's creativity, technical prowess, and dedication to client satisfaction are truly commendable.”

More Blog

Dashboard Insights

We explore the benefits of dashboard insights.

Read More

Real Time Analytics

We take a deep dive into real time analytics.

Read More

At Memesis AI, we’re dedicated to transforming work through AI

Take the first step towards achieving your business goals by contacting us today. Schedule a consultation with one of our Automation specialists to discuss your objectives and explore how our innovative solutions can drive your success.